# Python code
def greet(name):
    print(f"Hello, {name}!")

greet('World')AsciiDoc showroom
Here are a few examples to demonstrate what AsciiDoc, as a markup language, has to offer. Its capabilities far exceed those of Markdown. Thus, this page will only cover a small portion to give you a sense of what’s possible.
Checking out the source code of this page can also help you get started with AsciiDoc. For more information, you can refer to the official AsciiDoc and Asciidoctor documentation.
Table of Contents
- Source code listings
- Listings without syntax highlighting
- Text formatting
- Text replacements
- Footnotes
- Links
- Keyboard shortcuts, buttons and menu paths
- Admonition blocks
- Sidebar/Aside blocks
- Tables
- Passthrough blocks
- Images
- Lists
- Quotes
- Glossary
- Table of contents (TOC)
- Using Mathematical Formulas (STEM)
- Ascii Diagrams
Source code listings
Python source code (language is shown in the upper right corner):
Code block with an unknown language (language info ist not shown):
Start
Set counter to 0
While counter < 5 do
    Print "This is loop iteration", counter
    Increment counter by 1
End
For detailed information see the section "Literals and source code" in the AsciiDoc Syntax Quick Reference
Python code block with annotations.
def square(number):(1)
    return number ** 2

result = square(4)(2)
print(result)(3)| 1 | The function square calculates the square of a given number. |
| 2 | The function is called with the number 4, and the result is stored in result. |
| 3 | The result is printed to the console. |
You can also directly insert source code from a file into your AsciiDoc document. This way, you can display the same code in multiple places but only need to update it in one location. You can even embed production code directly.
HTML code block included from an external file. The first three lines of the file are skipped.
<!DOCTYPE html>
<html lang="en">
<head>
    <meta charset="UTF-8">
    <meta name="viewport" content="width=device-width, initial-scale=1.0">
    <title>Document</title>
</head>
<body>
    HTML boilerplate code.
</body>
</html>
Listings without syntax highlighting
The [source] block used for source code listings is a special type of listing block that applies syntax highlighting. For simple text listings (e.g. console output, folder structures, etc.) you can instead use the [listing] block.
Example of a folder structure listing. It is enriched with icons for files and folders taken from the Unicode standard. You can look up the Unicode of the icons on https://emojipedia.org/ and copy them from there. [1]
📄 config.yml
📂 data
	📂 images
		🖼️ photo1.jpg
		🖼️ photo2.jpg
		🖼️ photo3.jpg
📂 pages
	📄 index.adoc
	📄 ranges.adoc
📂 _posts
	📄 2025-10-08-title-of-the-article.adoc
Folder structure listing from the previous example, but with a tree-like structure directly taken from the output of the
tree command [2]. Additionally, annotations with automatic numbering are added.📂 ./
├── 📄 config.yml (1)
├── 📂 data
│ └── 📂 images (2)
│ ├── 🖼️ photo1.jpg
│ ├── 🖼️ photo2.jpg
│ └── 🖼️ photo3.jpg
├── 📂 pages (3)
│ ├── 📄 index.adoc
│ └── 📄 ranges.adoc
└──📂 _posts (4)
└── 📄 2025-10-08-title-of-the-article.adoc
| 1 | config-file |
| 2 | Folder with images |
| 3 | Folder with pages |
| 4 | Folder with blog posts |
Text formatting
-
Text with strong significance to me
-
Emphasized text
-
Combination of both
-
You can also format parts of a word:
-
Create, Read, Update, and Delete (CRUD)
-
Counterclockwise
-
strings
-
-
superscript
-
subscript
-
This is strikethrough text
-
This is underlined text
-
monospace text
Text replacements
-
->is replaced by → -
<-is replaced by ← -
=>is replaced by ⇒ -
<=is replaced by ⇐ -
(C)is replaced by © -
(R)is replaced by ® -
...is replaced by … -
(TM)is replaced by ™ -
a -- bis replaced by a — b
Footnotes
* A statement with a footnote. footnote:[Details about this statement.]
* A statement with a footnote!footnote:xyz[A named footnote with the id 'xyz'.]
* Another statement with the same footnote!footnote:xyz[]
Links
-
In AsciiDoc, you can easily add links to other articles: Example post for AsciiDoc with explanations.
-
You can also link to sections on the page using link anchors: Link to the section: "Adminition blocks" on this page
Keyboard shortcuts, buttons and menu paths
You must add the :experimental: attribute to the document header to enable these macros.
|
| AsciiDoc Code | Result |
|---|---|
|
Ctrl+Alt+Del |
|
|
|
Submit |
Admonition blocks
Admonition: TIP.
|
Admonition: IMPORTANT.
|
|
Admonition blocks (here shown for the admonition: A list with several items.
And even blocks with source code.
|
Admonition: CAUTION.
|
Admonition: WARNING.
|
Code for the inline command (here for a TIP):
TIP: Admonition: `TIP`.Code for the block command (here for a NOTE):
[NOTE]
====
...
====
Sidebar/Aside blocks
Tables
| Name | Age | City |
|---|---|---|
Max Mustermann |
30 |
Berlin |
John Doe |
45 |
New York |
Maria Musterfrau |
28 |
München |
| Feature | Description | Example |
|---|---|---|
Bold and Italics |
Supports italic and bold text formatting |
Italic and bold formatting |
This cell spans 3 columns |
||
This cell spans 2 rows |
First row of the spanned cell |
Another cell |
Second row of the spanned cell |
Another cell |
|
Links |
Supports links within the table |
|
Passthrough blocks
With passthrough blocks (delimited with ++++),
you can embed raw HTML code directly into your AsciiDoc document.
Common examples are the inclusion of an HTML form, CSS and JavaScript snippets.
| Keep in mind that this only affects the HTML output. It will be visible as-is in other output formats like PDF. |
To add a form to your document, you can use:
++++
<form onsubmit="alert('Thank you for subscribing!'); return false;">
  <input type="email" required placeholder="name@example.com">
  <button type="submit">Subscribe</button>
</form>
++++
The result is:

Lists
Unordered
-
Item 1
-
Item 2
-
Item 2.1
-
Item 2.2
-
Item 2.3
-
-
Item 3
Numbered
-
Numbered item 1
-
Numbered item 2
-
Numbered item 2.1
-
Numbered item 2.2
-
Numbered item 2.3
-
-
Numbered item 3
Checklist
-
checked:
* [*] -
checked:
* [x](lower case x!)-
checked:
- [*] -
checked:
- [x] -
unchecked:
- [ ]
-
-
unchecked:
* [ ]-
item without checkbox
-
unchecked item on level 2:
** [ ]-
checked item on level 3:
* [x]
-
-
Quotes
Fully annotated quote:
After being searched for Lorem ipsum:
Lorem ipsum dolor sit amet, consectetur adipiscing elit, sed do eiusmod tempor incididunt ut labore et dolore magna aliqua.
Ut enim ad minim veniam, quis nostrud exercitation ullamco laboris nisi ut aliquip ex ea commodo consequat.
Duis aute irure dolor in reprehenderit in voluptate velit esse cillum dolore eu fugiat nulla pariatur.
Excepteur sint occaecat cupidatat non proident, sunt in culpa qui officia deserunt mollit anim id est laborum.
— Wikipedia
published on https://en.wikipedia.org/wiki/Lorem_ipsum
published on https://en.wikipedia.org/wiki/Lorem_ipsum
Quotation lacking attribution and further information:
Veni, vidi, vici.
Glossary
Glossary entries can also contain lists, quotations, code-blocks, …
- Lorem ipsum
-
Lorem ipsum dolor sit amet, consectetur adipiscing elit, sed do eiusmod tempor incididunt ut labore et dolore magna aliqua. Ut enim ad minim veniam, quis nostrud exercitation ullamco laboris nisi ut aliquip ex ea commodo consequat. Duis aute irure dolor in reprehenderit in voluptate velit esse cillum dolore eu fugiat nulla pariatur. Excepteur sint occaecat cupidatat non proident, sunt in culpa qui officia deserunt mollit anim id est laborum.
- Lorem ipsum (with code block)
-
A common form of Lorem ipsum in a code block.
Lorem ipsum dolor sit amet, consectetur adipiscing elit, sed do eiusmod tempor incididunt ut labore et dolore magna aliqua. Ut enim ad minim veniam, quis nostrud exercitation ullamco laboris nisi ut aliquip ex ea commodo consequat. Duis aute irure dolor in reprehenderit in voluptate velit esse cillum dolore eu fugiat nulla pariatur. Excepteur sint occaecat cupidatat non proident, sunt in culpa qui officia deserunt mollit anim id est laborum. - Lorem ipsum (with list)
-
-
Lorem ipsum dolor sit amet, consectetur adipiscing elit, sed do eiusmod tempor incididunt ut labore et dolore magna aliqua.
-
Ut enim ad minim veniam, quis nostrud exercitation ullamco laboris nisi ut aliquip ex ea commodo consequat.
-
Duis aute irure dolor in reprehenderit in voluptate velit esse cillum dolore eu fugiat nulla pariatur.
-
Excepteur sint occaecat cupidatat non proident, sunt in culpa qui officia deserunt mollit anim id est laborum.
-
Table of contents (TOC)
As you can see at the top of this page, AsciiDoc can also generate a table of contents for you.
You can enable this directly in the AsciiDoc page attributes. For this page I used:
:toc: preamble
:toclevels: 5
Level 2 corresponds to <h3>
Level 3 corresponds to <h4>
Level 4 corresponds to <h5>
Level 5 corresponds to <h6>
Using Mathematical Formulas (STEM)
In this blog, you can easily use STEM
(Science, Technology, Engineering and Math) expressions in your pages and posts.
To do this, simply add the :stem: attribute to the document header of your page or post
(You can also enable it for all posts in your _config.yml):
= Page Title
:stem:
Two syntaxes for the formulas are are available:
-
AsciiMathML (AsciiMath is the default)
Examples using AsciiMath
Inline Command: (here \$[[a,b],[c,d]]((n),(k))\$.)
\$[[a,b],[c,d]]((n),(k))\$.
Block command:
The formula for the sum of cubes.
\$sum_(i=1)^n i^3=((n(n+1))/2)^2\$
The AsciiDoc code using AsciiMath that was used to create the above formula for the sum of cubes.
[asciimath]
++++
sum_(i=1)^n i^3=((n(n+1))/2)^2
++++
Examples using LaTeX
Inline command (here: \(C = \alpha + \beta Y^{\gamma} + \epsilon\)):
\(C = \alpha + \beta Y^{\gamma} + \epsilon\)
Block command:
Exponential Decay: The limit of the exponential function \(exp(-x)\) as \(x\) approaches infinity is zero.
\[\lim\limits_{x \to \infty} \exp(-x) = 0\]
The AsciiDoc code for the exponential decay equation shown above, written in LaTeX syntax.
[latexmath]
++++
\lim\limits_{x \to \infty} \exp(-x) = 0
++++
Ascii Diagrams
Text-based diagrams enable easy integration with version control systems, as they are saved in plain text. This format avoids binary files, making changes visible in diffs, so you can track updates precisely over time. Additionally, because they are text, different themes and styles can be applied without needing to redesign the diagram. Another benefit is that these diagrams can be generated automatically during the build process, eliminating the need for graphics editors or manual exports to specific formats. This makes them ideal for automated workflows and consistent documentation across projects.
Asciidoctor Diagram supports a wide range of text-based diagram types making it a versatile choice for creating diagrams directly within documentation.
The Docker image provided by jekyll-theme-endless currently ships with the software preinstalled to support the following diagram types: BlockDiag ( ActDiag, BlockDiag, NwDiag / RackDiag / PacketDiag, SeqDiag ), Bytefield-SVG, DBML, Ditaa, Dpic, Gnuplot, Graphviz, LilyPond, Mermaid, MscGen, Nomnoml, Pintora, PlantUML, State Machine Cat, WaveDrom, Barcodes and QR codes, BPMN, Meme, TikZ.
BlockDiag-Diagrams
These diagram-library provides support for several diagram types. Note that you can use the same code syntax to change the attributes in BlockDiag, ActDiag, NwDiag, RackDiag, PacketDiag, and SeqDiag diagrams. (for example to set colors [color = "#bbfcbb"], shapes [shape = "actor"], etc.).
BlockDiag
Diagrams created with BlockDiag can represent hierarchical structures, workflows, and relationships between components in a clear and organized manner. (See the examples of BlockDiag diagrams).

Figure 2. Example of a BlockDiag diagram illustrating a simple flowchart with two branches, connections an a group.
ActDiag
ActDiag is designed for creating activity diagrams, which are useful for modeling workflows and processes, showing the flow of control from one activity to another. (See the examples of ActDiag diagrams).

Figure 3. Example of an ActDiag diagram illustrating a simple workflow with user actions and system processes.
NwDiag
NwDiag is specialized for network diagrams, allowing you to visualize network topologies, connections, and configurations of network devices. (See the examples of NwDiag diagrams).

Figure 4. Example of a NwDiag diagram illustrating a simple network topology with DMZ and internal networks.
RackDiag
RackDiag is used for creating rack diagrams, which are ideal for visualizing the physical layout of servers and network equipment within data center racks. (See the examples of RackDiag diagrams).

Figure 5. Example of a RackDiag diagram illustrating a simple server rack layout with various equipment installed in 8 of 16 units.
PacketDiag
PacketDiag is used for creating packet diagrams, which are useful for visualizing network packet flows and interactions between network entities. (See the examples of PacketDiag diagrams).

Figure 6. Example of a PacketDiag diagram illustrating the structure of a TCP packet with various fields and flags.
SeqDiag
SeqDiag is designed for sequence diagrams, allowing you to model interactions between objects or components over time, showing the sequence of messages exchanged. (See the examples of SeqDiag diagrams).

Figure 7. Example of a SeqDiag diagram illustrating a simple client-server interaction with requests and responses.
Bytefield-SVG
Bytefield-SVG is ideal for visualizing data structures at the byte level, making it useful for understanding memory layouts, protocol formats, and binary data representations. (See the Introduction to Bytefield-SVG and Bytefield-SVG on GitHub).

Figure 8. Example of a Bytefield-SVG diagram illustrating the structure of an IPv4 header (RFC791) with various fields and their bit lengths. (Example taken and adapted from examples of Bytefield-SVG diagrams).
DBML
DBML (Database Markup Language) is designed for modeling database schemas and structures in a clear and concise manner, making it easier to visualize and understand database designs. (See the DBML Renderer on GitHub, examples directory, and the DBML Command Line Tool).

Figure 9. Example of a DBML diagram illustrating a simple database schema with two tables, an enum type, and a relationship between the tables.
Ditaa
Ideal for converting ASCII art into diagrams, especially useful for quick sketches and block diagrams.

Figure 10. Example of a Ditaa diagram illustrating the flow of processing in Asciidoctor Diagram, where a text document is converted through Asciidoctor with Ditaa to produce a PNG output, showcasing the transformation from plain text to visually structured output.
Check the AsciiDoc source of this page to see that the diagram is clearly recognizable even in the text. This is a unique feature of Ditaa.

Figure 11. Example of a table-style diagram in Ditaa, illustrating a 2x2 matrix layout with labeled cells and placeholder mathematical expressions, showcasing how different background colors can be applied to each cell.(Parameter: a=4, b=6);
Dpic
Dpic is an implementation of the Pic-DSL (Pic Domain-Specific Language) and is especially well-suited for generating precise diagrams, graphs, and technical illustrations directly from text-based descriptions.

Figure 12. This diagram demonstrates a polar coordinate system rendered with the Pic graphics language.

Figure 13. This diagram illustrates the 'Magic Triangle of Cost, Time and Quality' created with simple pic code. Lines between the circles are colored and habe a different value for the
thickness.Gnuplot
Gnuplot is a powerful plotting utility that allows users to create a wide variety of 2D and 3D plots from data and mathematical functions. This makes it ideal for visualizing scientific data, mathematical functions, and statistical information.

Figure 14. Example of a simple parabola plotted using Gnuplot, demonstrating the function y = x² over the range from -10 to 10, with labeled axes and a title.
Graphviz
Useful for directed and undirected graphs, including flowcharts, state diagrams, and dependency graphs.

Figure 15. Example of a directed graph in Graphviz, illustrating nodes with connections, including a self-loop on node b and cyclical paths between nodes.
Lilypond
LilyPond is a music engraving program that enables users to create beautifully typeset sheet music through a text-based input system, focusing on producing high-quality, professional-looking scores suitable for publication.
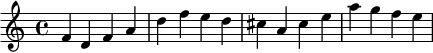
Figure 16. Example of a melody in LilyPond notation, demonstrating a simple sequence of notes with pitches relative to the starting note c'.
Mermaid
mermaid.js is ideal for creating flowcharts, sequence diagrams, Gantt charts, and more.

Figure 17. Example of a Sankey diagram that shows the distribution of construction costs across different trades, as well as the material and labor costs.

Figure 18. Example of a flowchart in Mermaid, demonstrating a simple decision tree with two options.
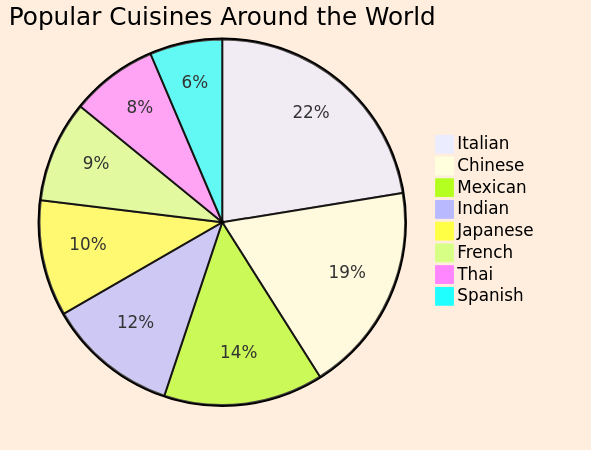
Figure 19. Example of a pie chart in Mermaid, showing the popularity of different types of cuisine worldwide. Additionally, the use of the background attribute in Mermaid is demonstrated, with the color set to FFEEDD.
MscGen
MscGen is a tool for creating message sequence charts (*MSC*s), ideal for visualizing interactions between entities (Systems, Actors, etc.) over time.

Nomnoml
Nomnoml is a simple and intuitive tool for creating UML diagrams.

Figure 20. A flowchart in Nomnoml, illustrating a decision-making process for troubleshooting a non-working lamp, including states, decisions, and actions.
Pintora
Pintora is a versatile diagramming tool that supports various types of diagrams, including activity diagrams, sequence diagrams, and class diagrams.

Figure 21. Example of a mind map created with Pintora, illustrating the categorization of UML diagrams into behavior and structural diagrams, along with specific types under each category. The diagram uses a left-to-right layout and custom colors for different levels of nodes.

Figure 22. Example of a Gantt chart created with Pintora, outlining a software project plan with various phases, tasks, and dependencies. The chart includes parameters for font color, bar gap, bar height, and grid line padding, as well as markers for the project start date and current date.
PlantUML
Great for creating UML diagrams like class diagrams, sequence diagrams, and activity diagrams.

Figure 23. Example of a class diagram in PlantUML, depicting a hierarchy where
DiagramBlock and BlockProcessor classes are related, with DiagramBlock having subclasses DitaaBlock and PlantUmlBlock.
Figure 24. Example of a sequence diagram in PlantUML, showing an interaction where Bob greets Alice with 'hello,' and Alice responds with 'hi.'

Figure 25. Example of a mind map illustrating concepts in the field of Artificial Intelligence (AI) and Machine Learning (ML).
State Machine Cat
State Machine Cat (smcat) is a tool for creating state machine diagrams.

Figure 26. Example [5] of a state machine diagram created with State Machine Cat, illustrating the behavior of a cat. The diagram demonstrates the use of colors and different line widths to enhance the visual representation of states and transitions. The diagram is laid out from left to right using the "circo" engine.
WaveDrom
WaveDrom is a tool for visualizing signal transitions and timing relationships in digital circuits and systems. Also see WaveDrom on GitHub.

Figure 27. Example of a WaveDrom diagram illustrating a simple digital circuit that implements an XOR gate using basic logic gates (AND, OR, NOT). The diagram shows the input signals 'a' and 'b,' as well as the output signal 'out,' which is derived from the logical operations on the inputs. Example taken from the WaveDrom tutorial (Part 2).

Figure 28. Example of a WaveDrom timing diagram illustrating the behavior of several digital signals over time, including clock cycles, data values, request and acknowledge signals. The diagram uses waveforms to represent the state transitions of each signal. Example taken from the WaveDrom tutorial (Part 1).
QR codes and Barcodes
For details on how to use the QR code and barcode features, see the Asciidoctor Diagram documentation on Barcodes and QR Codes.
Block version of QR Codes (PNG and SVG)

Figure 29. QR code in SVG format using a code block and a specified x-dimension (value of
7).
Figure 30. QR code in PNG format using a block macro and a specified x-dimension (value of
5).Inline version of Barcodes and QR codes (PNG)
-
qrcode:

-
code128:

-
ean13:

-
upca:

BPMN
BPMN is a tool for creating Business Process Model and Notation diagrams, which are used to model business processes in a graphical representation. You can easily build your own BPMN diagrams online.

Figure 31. Example of a BMPN diagram included via the
include::path/to/file.bpmn[]-command. You can also add the XML code directly to your AsciiDoc source code, but this makes it more difficult to edit the diagram with a BPMN editor. (QR code example taken and adapated from the bpmn-js example page).Meme
The meme extension is based on ImageMagick and is used to create simple memes with text overlaid on images.

Figure 32. Example of a meme created with the Meme diagram type, featuring an image of a cat with overlaid text at the top and bottom. The text is styled with a stroke width of 2 and a white fill color to enhance visibility against the background image.
TikZ
TikZ is a powerful and user-friendly syntax layer built upon the PGF (Portable Graphic Format) package for creating high-quality graphics programmatically within LaTeX documents.

Figure 33. Example of a simple diagram created with TikZ, demonstrating the drawing of a grid, coordinates, and arrows between points. The diagram includes a red arrow to highlight a specific direction. The diagram is scaled by a factor of 2.3 and uses ultra thick lines for better visibility.

Figure 34. Example [6] of a more complex 3D diagram created with TikZ, illustrating a tetrahedron inscribed within a parallelepiped. The diagram uses perspective angles and colors to enhance the visual representation of the shapes and their vertices.
1. The icons may not be displayed correctly in all fonts and browsers. Unicode 6.0 was the first version of the Unicode Standard to support emoji.
2. The tree command is a standard Unix command used to display the directory structure of a path in a tree-like format. If not istalled, use
sudo apt install tree on Debian-based systems to install it.
3. Details about this statement.
4. A named footnote with the id 'xyz'.